Mobile gaming is still the biggest gaming platform by both revenue and players. Below are the latest widely cited, report-backed stats (mostly 2024 results, plus select 2025 updates).
mobile gaming statistics
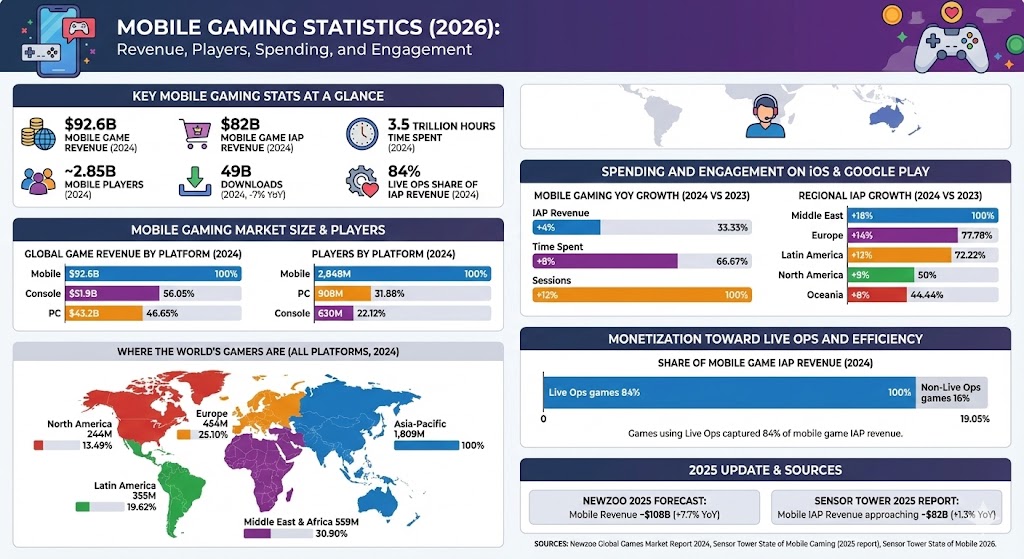
Key mobile gaming stats at a glance
Mobile game revenue (2024): $92.6B (about 49% of global games revenue).
Mobile players (2024): ~2.85B people played on mobile.
Mobile game in-app purchase (IAP) revenue (2024): $82B.
Time spent in mobile games (2024): 3.5 trillion hours.
Mobile game downloads (2024): 49B downloads (down ~7% YoY).
Live Ops share (2024): games using Live Ops captured 84% of mobile game IAP revenue.
Mobile gaming market size
Newzoo estimates the global games market at $187.7B in 2024, with mobile gaming generating $92.6B—the largest of the three major segments (mobile, console, PC).
Global game revenue by platform (2024)
Platform
Relative size
Revenue
Mobile
$92.6B
Console
$51.9B
PC
$43.2B
Max = $92.6B. Widths: Mobile 100.00%, Console 56.05%, PC 46.65%
How many people play mobile games?
Newzoo’s 2024 forecasts put total gamers at 3.422B globally, with mobile reaching 2.848B players—far above PC and console in player count.
Players by platform (2024)
Platform
Relative size
Players
Mobile
2,848M
PC
908M
Console
630M
Max = 2,848M. Widths: Mobile 100.00%, PC 31.88%, Console 22.12%
Where the world’s gamers are (all platforms, 2024)
On a total-player basis (all platforms), Asia-Pacific is the largest region by far, followed by Middle East & Africa and Europe.
Region
Relative size
Players
Asia-Pacific
1,809M
Middle East & Africa
559M
Europe
454M
Latin America
355M
North America
244M
Max = 1,809M. Widths: Asia-Pacific 100.00%, Middle East & Africa 30.90%, Europe 25.10%, Latin America 19.62%, North America 13.49%
Spending and engagement on iOS and Google Play
Sensor Tower’s reporting (iOS + Google Play) shows 2024 as a year of stabilization and renewed growth in engagement: $82B in mobile game IAP revenue, 3.5T hours spent, and sessions up 12% YoY even as downloads declined.
Mobile gaming YoY growth (2024 vs 2023)
Metric
Relative growth
YoY change
IAP revenue
+4%
Time spent
+8%
Sessions
+12%
Max = +12%. Widths: IAP revenue 33.33%, Time spent 66.67%, Sessions 100.00%
Regional IAP growth where momentum was strongest (2024 vs 2023)
Region
Relative growth
YoY change
Middle East
+18%
Europe
+14%
Latin America
+13%
North America
+9%
Oceania
+8%
Max = +18%. Widths: Middle East 100.00%, Europe 77.78%, Latin America 72.22%, North America 50.00%, Oceania 44.44%
Monetization is shifting toward Live Ops and efficiency
As user acquisition costs rise and downloads soften, leading publishers have leaned harder into retention and recurring spend. Sensor Tower reports that games using Live Ops captured 84% of mobile game IAP revenue in 2024.
Share of mobile game IAP revenue tied to Live Ops (2024)
Category
Relative size
Share
Live Ops games
84%
Non-Live Ops games
16%
Max = 84%. Widths: Live Ops games 100.00%, Non-Live Ops games 19.05%
2025 update: what changed most recently?
Two useful “directional” updates for 2025 (note: different firms use different definitions):
Newzoo expected mobile to generate $108B in 2025 revenue (+7.7% YoY) as part of a $197B global games market estimate.
Sensor Tower reported mobile gaming IAP revenue approaching $82B in 2025 (+1.3% YoY), while the broader mobile market saw non-game apps surpass games in total mobile revenue.
Sources
Newzoo — Global Games Market Report 2024 (free version) and related 2024 revenue estimates
Sensor Tower — State of Mobile Gaming (2025 report results for 2024) and related press release
Sensor Tower — State of Mobile 2026 (2025 mobile market context)