Gaming spans all ages and backgrounds, making demographics one of the most useful lenses for understanding the market. Below are practical gamer demographic stats (largely from 2024 datasets) with charts.
gamer demographics statistics
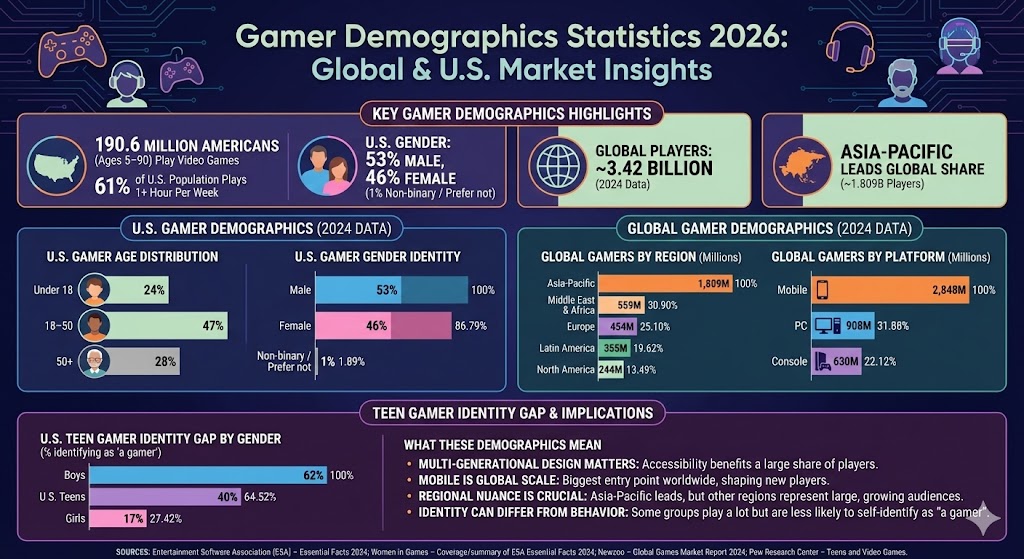
Key gamer demographics highlights
190.6 million Americans (ages 5–90) play video games, and 61% of the U.S. population reports playing at least 1 hour per week.
In the U.S., 53% of players identify as male and 46% as female (with a small remainder selecting another option).
Globally, the number of players is commonly cited at about 3.42 billion in 2024.
Asia-Pacific accounts for the largest share of global players (about 1.809B in 2024).
U.S. gamer age distribution (2024)
U.S. gaming is broadly multi-generational, with a sizable 50+ segment alongside strong participation among younger groups.
Label
Bar
Value
Under 18
24%
18–50
47%
50+
28%
Max = 47%. Widths: Under 18 51.06%, 18–50 100.00%, 50+ 59.57%.
U.S. gamer gender identity (2024)
U.S. gaming is close to an even split by gender, with a small share selecting non-binary or preferring not to identify.
Label
Bar
Value
Male
53%
Female
46%
Non-binary / Prefer not
1%
Max = 53%. Widths: Male 100.00%, Female 86.79%, Non-binary / Prefer not 1.89%.
Global gamers by region (2024)
Asia-Pacific is the largest player region, with major player bases also in the Middle East & Africa, Europe, Latin America, and North America.
Label
Bar
Value
Asia-Pacific
1,809M
Middle East & Africa
559M
Europe
454M
Latin America
355M
North America
244M
Max = 1,809M. Widths: Asia-Pacific 100.00%, Middle East & Africa 30.90%, Europe 25.10%, Latin America 19.62%, North America 13.49%.
Global gamers by platform (2024)
Mobile dominates global reach, with PC and console each contributing large (but smaller) player bases.
Label
Bar
Value
Mobile
2,848M
PC
908M
Console
630M
Max = 2,848M. Widths: Mobile 100.00%, PC 31.88%, Console 22.12%.
Teen gamer identity gap by gender
Among U.S. teens, many play games, but far fewer girls label themselves “a gamer” compared with boys.
Label
Bar
Value
Boys
62%
U.S. teens
40%
Girls
17%
Max = 62%. Widths: Boys 100.00%, U.S. teens 64.52%, Girls 27.42%.
What these demographics mean
Multi-generational design matters: accessibility, readability, and flexible difficulty benefit a large share of players.
Mobile is global scale: mobile is the biggest entry point worldwide, shaping how most new players start gaming.
Regional nuance is crucial: Asia-Pacific leads in player base, but other regions represent large and growing audiences.
Identity can differ from behavior: some groups play a lot but may be less likely to self-identify as “a gamer,” influencing community and marketing.
Sources
Entertainment Software Association (ESA) – Essential Facts 2024 (U.S. age, gender, and player counts).
Women in Games – Coverage/summary of ESA Essential Facts 2024 (gender breakout context).
Newzoo – Global Games Market Report 2024 (global players by region and platform).
Pew Research Center – Teens and Video Games (teen gamer identity by gender).