Mac vs PC looks very different depending on whether you measure web traffic, shipments, gaming, or professional use. Below are the most-cited, recent benchmarks with charts.
macs vs pc statistics
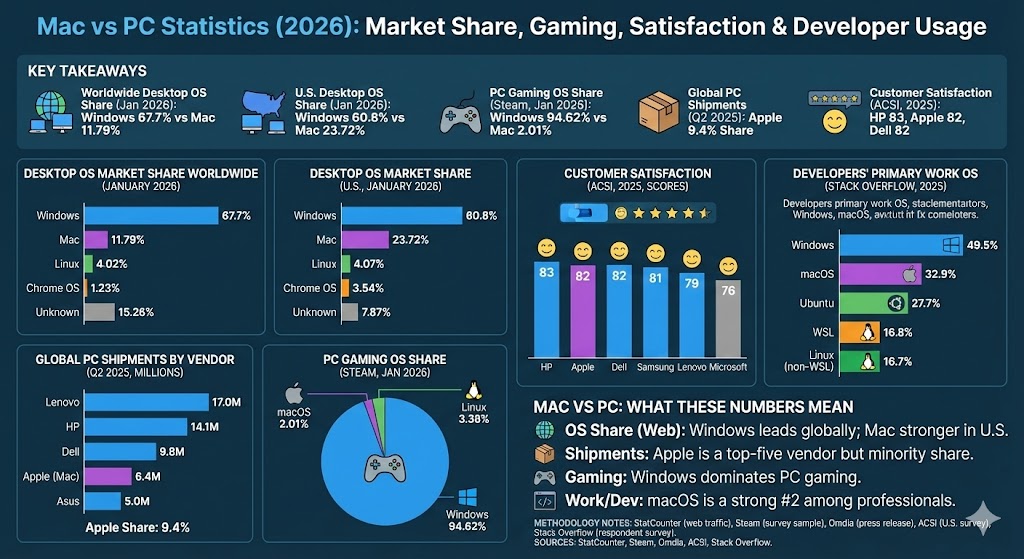
Key takeaways
Worldwide desktop OS share (Jan 2026): Windows 67.7% vs Mac (OS X + macOS) 11.79% (StatCounter).
U.S. desktop OS share (Jan 2026): Windows 60.8% vs Mac (OS X + macOS) 23.72% (StatCounter).
PC gaming OS share (Steam, Jan 2026): Windows 94.62%, macOS 2.01%, Linux 3.38%.
Global PC shipments (Q2 2025): Apple shipped 6.4M PCs and held 9.4% share (Omdia press release).
Customer satisfaction (ACSI, 2025): HP 83, Apple 82, Dell 82 (out of 100).
Developers’ primary work OS (Stack Overflow, 2025): Windows 49.5%, macOS 32.9%, Ubuntu 27.7% (professional use).
Desktop OS share worldwide
StatCounter’s desktop OS chart is based on desktop web traffic. Apple’s desktop OS appears split into OS X and macOS on the StatCounter desktop page, so “Mac” below is the combined total for that snapshot.
Desktop OS market share worldwide (January 2026)
Label
Bar
Value
Windows
67.7%
Mac (OS X + macOS)
11.79%
Linux
4.02%
Chrome OS
1.23%
Unknown
15.26%
Max = 67.7%. Widths: Windows 100.00%, Mac (OS X + macOS) 17.42%, Linux 5.94%, Chrome OS 1.82%, Unknown 22.54%.
Desktop OS share in the United States
The U.S. typically shows a higher Mac share than the worldwide desktop snapshot, but Windows remains the majority in desktop web traffic.
Desktop OS market share (U.S., January 2026)
Label
Bar
Value
Windows
60.8%
Mac (OS X + macOS)
23.72%
Linux
4.07%
Chrome OS
3.54%
Unknown
7.87%
Max = 60.8%. Widths: Windows 100.00%, Mac (OS X + macOS) 39.01%, Linux 6.69%, Chrome OS 5.82%, Unknown 12.94%.
PC shipments: where Apple sits in the overall market
Shipment rankings usually reflect the total PC market (mostly Windows laptops/desktops plus some Chromebooks). Apple is the only major vendor shipping macOS at scale, so its position here is a rough proxy for “Macs vs the broader PC market.”
Global PC shipments by vendor (Q2 2025, millions of units)
Label
Bar
Value
Lenovo
17.0M
HP
14.1M
Dell
9.8M
Apple (Mac)
6.4M
Asus
5.0M
Max = 17.0M. Widths: Lenovo 100.00%, HP 82.94%, Dell 57.65%, Apple 37.65%, Asus 29.41%.
Extra context: In the same Q2 2025 snapshot, Apple’s share is stated as 9.4% of global PC shipments (Omdia).
PC gaming OS share (Steam)
Steam’s hardware survey is a strong proxy for consumer PC gaming. In January 2026, Windows overwhelmingly dominated Steam usage, with macOS and Linux making up the remainder.
Steam OS share (January 2026, combined)
Label
Bar
Value
Windows
94.62%
Linux
3.38%
macOS
2.01%
Max = 94.62%. Widths: Windows 100.00%, macOS 2.12%, Linux 3.57%.
Customer satisfaction (U.S.)
In ACSI’s most recent personal computer benchmark (2025), HP ranked #1 overall, with Apple and Dell close behind.
ACSI personal computer satisfaction scores (2025, selected brands)
Label
Bar
Value
HP
83
Apple
82
Dell
82
Samsung
81
Lenovo
79
Microsoft
76
Max = 83. Widths: HP 100.00%, Apple 98.80%, Dell 98.80%, Samsung 97.59%, Lenovo 95.18%, Microsoft 91.57%.
Which OS developers use at work
Among professional developers in Stack Overflow’s 2025 survey, Windows leads, but macOS is a large #2—much stronger than its share in general desktop web traffic.
Primary OS for professional developers (Stack Overflow, 2025)
Label
Bar
Value
Windows
49.5%
macOS
32.9%
Ubuntu
27.7%
WSL
16.8%
Linux (non-WSL)
16.7%
Max = 49.5%. Widths: Windows 100.00%, macOS 66.46%, Ubuntu 55.96%, Linux (non-WSL) 33.74%, WSL 33.94%.
Mac vs PC: what these numbers usually mean
OS share (web traffic): Windows typically leads, while Macs tend to be stronger in the U.S. than worldwide.
Shipments: Apple is a top-five PC vendor globally in many quarters, but it is still a minority of total PC shipments.
Gaming: Windows remains the default platform for PC gaming, with macOS a small share on Steam.
Work/dev: macOS has a much larger footprint among developers than in general desktop web traffic.
Methodology notes
StatCounter: estimates desktop OS share from desktop web traffic, not installed base.
Steam: survey participation is optional; numbers reflect Steam users who were sampled, not all PC owners.
Omdia: shipment totals and share are from an industry press release snapshot (Q2 2025).
ACSI: satisfaction scores are U.S.-focused and are survey-based (0–100 scale).
Stack Overflow: developer survey results reflect respondents, not the full developer population.
Sources
StatCounter Global Stats (Desktop OS market share: Worldwide and United States, January 2026 snapshots)
Steam Hardware & Software Survey (January 2026, OS share)
Omdia press release: “Worldwide PC shipments up 7% in Q2 2025” (vendor shipments and Apple share)
American Customer Satisfaction Index (ACSI): Personal Computers benchmarks (most recent data: 2025)