This article compiles recent, directly comparable PC vs console gaming stats—covering market revenue, player counts, and U.S. platform usage patterns.
pc vs console gaming statistics
Key takeaways
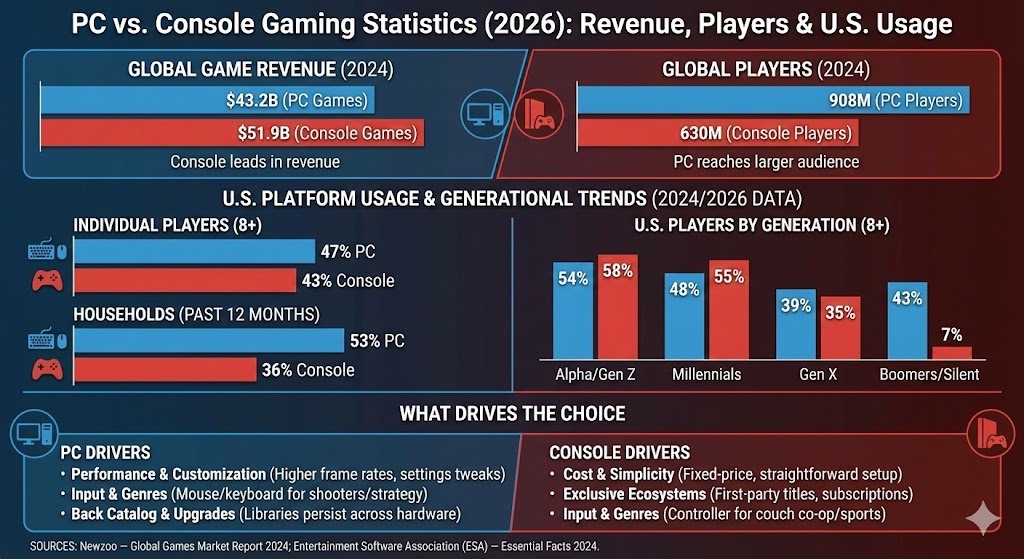
Global game revenue (2024): Console games generated $51.9B vs $43.2B for PC games.
Global players (2024): PC had 908M players vs 630M console players.
U.S. individual usage (players 8+):47% play on PC and 43% play on console.
U.S. households:53% report PC play and 36% report console play in the past 12 months.
By generation: Gen Alpha/Gen Z show the highest console usage (58%) and strong PC usage (54%).
Global market: PC vs console revenue
On a revenue basis, consoles remain larger than PC in 2024, though both are major software markets.
Global game revenues by platform (2024, USD billions)
Label
Bar
Value
PC games
$43.2B
Console games
$51.9B
Max = 51.9. Widths: PC games 83.24%, Console games 100.00%.
Global audience: PC vs console players
In player count, PC reaches a larger audience globally than consoles—reflecting broad accessibility (including lower-end PCs and laptops) and strong penetration in multiple regions.
Global players by platform (2024, millions)
Label
Bar
Value
PC players
908M
Console players
630M
Max = 908. Widths: PC players 100.00%, Console players 69.38%.
U.S. platform usage: where players actually play
In the U.S., reported PC and console usage are close among individual players (players 8+), with PC slightly ahead in this dataset.
Gaming devices played among U.S. individual players (players 8+)
Label
Bar
Value
PC
47%
Console
43%
Max = 47. Widths: PC 100.00%, Console 91.49%.
Platforms played among U.S. households (past 12 months)
Label
Bar
Value
PC
53%
Console
36%
Max = 53. Widths: PC 100.00%, Console 67.92%.
PC vs console by generation (U.S. players 8+)
Console usage skews strongly younger in this dataset, while PC usage remains comparatively steady across generations.
Gaming platforms played by generation (U.S. players 8+)
Label
Bar
Value
Alpha/Gen Z — PC
54%
Alpha/Gen Z — Console
58%
Millennials — PC
48%
Millennials — Console
55%
Gen X — PC
39%
Gen X — Console
35%
Boomers/Silent — PC
43%
Boomers/Silent — Console
7%
Max = 58. Widths: Alpha/Gen Z — PC 93.10%, Alpha/Gen Z — Console 100.00%, Millennials — PC 82.76%, Millennials — Console 94.83%, Gen X — PC 67.24%, Gen X — Console 60.34%, Boomers/Silent — PC 74.14%, Boomers/Silent — Console 12.07%.
PC vs console: what typically drives the choice
Cost & simplicity: Consoles offer a fixed-price box and straightforward setup; PCs span a wide budget range.
Performance & customization: PCs can scale to higher frame rates/resolution and support extensive hardware and settings tweaks.
Exclusive ecosystems: First-party console exclusives and subscription libraries can strongly influence platform selection.
Input & genres: Competitive shooters/strategy titles often over-index on PC (mouse/keyboard), while couch co-op and sports/fighting titles often thrive on consoles.
Back catalog & upgrades: PC libraries persist across hardware upgrades; consoles are tied more closely to generational cycles (with increasing backward compatibility).
Sources
Newzoo — Global Games Market Report 2024 (free version) (revenue and global player counts).
Entertainment Software Association (ESA) — Essential Facts 2024 (U.S. platform usage by players, households, and generation).