The gaming PC market is being pulled forward by esports, streaming/creator workloads, and ever-higher performance targets in modern games.Here are the key market size, demand, and hardware-usage stats most commonly used for benchmarking.
gaming pc market statistics
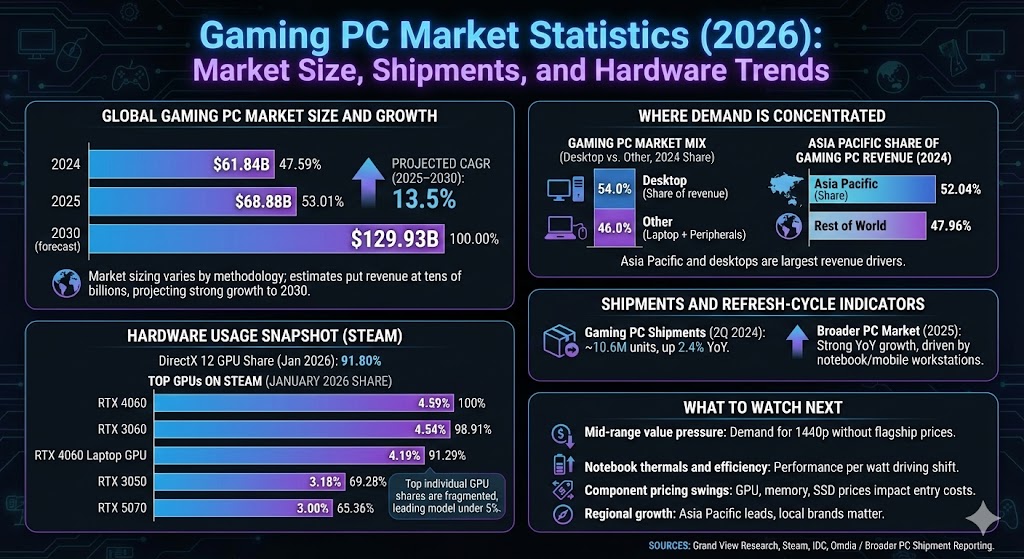
Global gaming PC market size and growth
Market sizing varies by methodology, but one widely cited industry estimate puts the gaming PC market at tens of billions in annual revenue and projecting strong growth into 2030.
2024 market size: $61.84B
2025 market size (estimated): $68.88B
2030 projected market size: $129.93B
Projected CAGR (2025–2030): 13.5%
Chart: Global Gaming PC Market Size (USD Billions)
Two headline concentration stats: revenue is heavily weighted toward Asia Pacific, and desktops are still the largest product category by revenue share.
Asia Pacific share (2024): 52.04%+
Desktop share (2024): 54.0%+
Chart: Gaming PC Market Mix (Desktop vs. Other Categories, 2024 share)
Category
Share bar
Value
Desktop (share of revenue, 2024)
54.0%
Other (laptop+peripherals)
46.0%
Max = 54.0%. Widths: Desktop (share of revenue, 2024) 100.00%, Other (laptop+peripherals) 85.19%.
Chart: Asia Pacific Share of Gaming PC Revenue (2024)
Region group
Share bar
Value
Asia Pacific (2024 share)
52.04%
Rest of world
47.96%
Max = 52.04%. Widths: Asia Pacific (2024 share) 100.00%, Rest of world 92.16%.
Shipments and refresh-cycle indicators
Shipments and upgrade cycles are a major swing factor for gaming PCs because the category is sensitive to GPU/CPU launches, component pricing, and broader PC replacement waves.
Gaming PC shipments (2Q 2024): ~10.6M units, up 2.4% year over year
Broader PC market (2025): up strongly year over year, with a large share of volume coming from notebook/mobile workstation shipments
Hardware usage snapshot (Steam)
Steam’s monthly Hardware & Software Survey is one of the most-used public “reality checks” for what PC gamers are actually running.
DirectX 12 GPU share (Jan 2026): 91.80%
Top individual GPU shares are fragmented: the leading single model is still under 5% share